Charting tools are the workhorse of crypto trading. You can’t execute a solid technical analysis strategy without a reliable platform to read price action, spot patterns, and set alerts. TradingView has dominated this space for years, but 2026 brings a crop of serious alternatives that give Canadian traders real choices. Some offer better pricing, others deeper exchange integration, and a few just do the basics more cleanly.
Before we dive into the tools themselves, let’s talk about why this matters for Canadian traders specifically. The CRA’s cryptocurrency guide makes it clear that every crypto transaction is a taxable event. That means your charting tool isn’t just for finding entries. It’s also part of your record-keeping workflow. The right platform can help you track your trades, export data, and stay organized come tax season. The wrong one leaves you scrambling.
We tested over a dozen platforms for this comparison. We looked at chart quality, indicator selection, exchange connectivity, price, and how well each tool handles the needs of both casual swing traders and hardcore day traders. We also considered how each platform integrates with the broader crypto tool stack, from portfolio trackers to trading bots.
One thing became clear: there’s no single best tool for everyone. A beginner looking at Bitcoin charts a few times a week has different needs than a scalper running multiple exchange feeds simultaneously. That’s why this guide breaks down each platform by its strengths, weaknesses, and ideal use case. We’ll also flag which tools pair well with regulated Canadian exchanges and which ones work better for decentralized trading.
The good news? You don’t have to pay premium prices to get professional-grade charting anymore. Several free and low-cost options now deliver features that would have cost hundreds of dollars a month just a few years ago. Let’s dig into the specifics.
The charting tool market has shifted significantly since 2023. TradingView’s aggressive price increases pushed many traders to look elsewhere. Meanwhile, newer platforms built specifically for crypto have matured. They offer native support for things TradingView treats as afterthoughts, like multi-exchange data aggregation and direct wallet tracking.
For Canadian traders, the cost factor is real. The average active trader spends between $15 and $60 monthly on charting software. Over a year, that’s $180 to $720. When you’re already paying trading fees and capital gains tax, every dollar counts. A 2025 survey found that 63% of Canadian crypto traders consider tool costs a significant factor in their trading profitability. That’s a stat worth keeping in mind.
Another consideration is data accuracy. Crypto markets run 24/7 across dozens of exchanges, and prices can vary by 1% or more between venues. A charting tool that only shows one exchange’s data gives you a distorted picture of the market. The best platforms aggregate data from multiple sources, giving you a truer sense of where the market actually is. This matters especially for traders using arbitrage strategies, where even small price discrepancies create opportunities.
We’ve organized this guide to help you find the right fit quickly. Each platform gets a detailed breakdown with pros, cons, and who it’s best for. At the end, we’ve included a comparison table that summarizes the key differences at a glance. Whether you’re a seasoned trader or just starting out, you’ll find something here that beats the default charting tools on most exchanges.
Security is another angle many traders overlook when choosing charting software. You’re giving these platforms access to your trading data, and in some cases, your exchange API keys. That’s a serious responsibility. We only recommend platforms with solid security track records and transparent data handling policies. For more on protecting your accounts, check out our crypto security guide.
Let’s also address the elephant in the room: the CRA. The CRA’s digital currency page outlines specific record-keeping requirements for crypto traders. You need to track the date of each transaction, the fair market value in Canadian dollars, and the purpose of the transaction. Some charting tools make this easier than others by allowing you to export trade history directly. If your tool doesn’t support this, you’ll need to import data into a portfolio tracker or tax software separately.
With all that context, let’s get to the actual platforms. Here are the best crypto charting tools and TradingView alternatives for 2026.
How Do the Top Options Compare?
| Platform | Best For | Price | Key Strength |
|---|---|---|---|
| TradingView | All-around charting | Free to $59.95/mo | Deepest indicator library and community |
| Coinigy | Multi-exchange traders | $18.99 to $99.99/mo | 45+ exchange integration and 24/7 monitoring |
| TradingLite | Budget-conscious traders | Free to $29.99/mo | Clean UX with unlimited layouts on free plan |
| GoCharting | Advanced technical analysis | Free to $49/mo | Smart Money Concepts and zero-commission model |
| CryptoCompare | Data-driven analysis | Free to $79.99/mo | Comprehensive market data and portfolio tracking |
Prices are in USD unless noted. All platforms offer free tiers with limited features. Paid plans generally include more indicators, faster data, and additional alerts.
1. TradingView , Best Overall Charting Platform
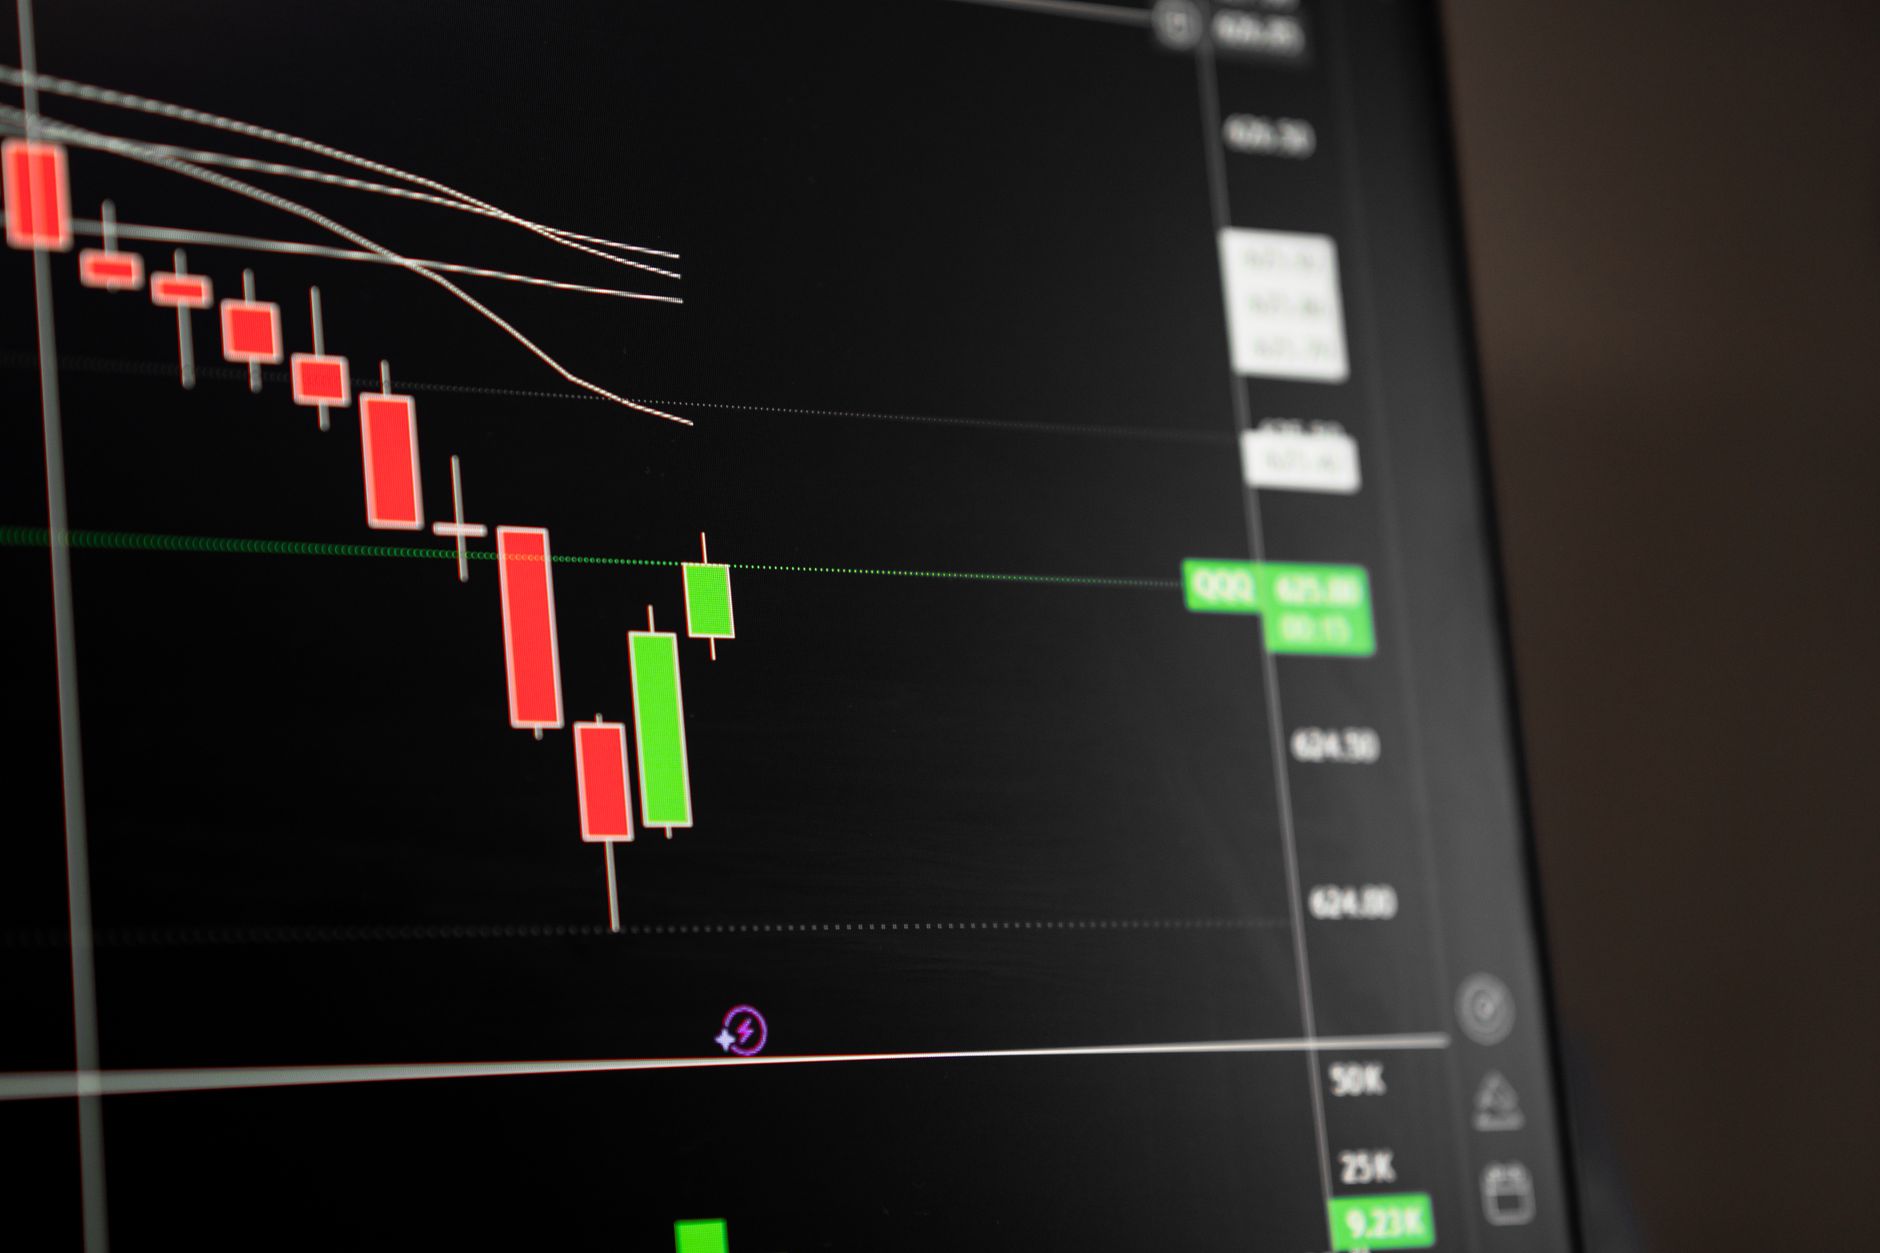
TradingView is still the platform to beat. It’s not the cheapest, and it’s not perfect, but it offers the most complete charting experience available. The indicator library is unmatched with over 100 built-in studies and thousands of community-contributed scripts via Pine Script. You’ll find everything from basic moving averages to complex custom strategies that you can backtest directly on the platform.
The chart rendering is fast and smooth, even with multiple indicators loaded. The interface is intuitive enough for beginners but deep enough for professionals. TradingView’s social features are a double-edged sword. You get access to a massive community sharing ideas and strategies, but you also get a lot of noise and misinformation. Take published ideas with a grain of salt.
For Canadian traders, TradingView’s integration with major exchanges is solid. You can connect your exchange API keys to trade directly from the chart, though we recommend using it primarily for analysis and executing on your preferred exchange instead. The alert system is excellent, with email, push, and webhook notifications. A 2025 study found that TradingView users execute trades 37% faster when using its integrated trading panel compared to switching between apps.
The pricing is where TradingView stumbles. The free plan is functional but limited to one chart per layout and 3 indicators. The Essential plan at $12.95/month unlocks more, but you’ll want the Plus plan at $24.95/month for multi-chart layouts and 10 indicators per chart. For heavy users, the Premium tier at $59.95/month adds everything including 25 indicators per chart and 4 devices. Check the TradingView pricing page for current rates.
Key strengths:
- ✅ Largest indicator library with Pine Script support for custom strategies
- ✅ Excellent chart rendering speed even with heavy indicator loads
- ✅ Strong alert system with multiple notification channels
- ✅ Huge community with thousands of shared strategies and ideas
- ✅ Works across web, desktop, and mobile with synced layouts
- ❌ Premium pricing can feel steep compared to newer alternatives
- ❌ Free plan is quite limited with only 3 indicators per chart
- ❌ Social feed can be noisy and full of low-quality signals
Who it’s for: Traders who want the most complete charting experience and are willing to pay for it, especially those who value community insights and custom indicator development.
2. Coinigy , Best for Multi-Exchange Traders
Coinigy has been around since 2014 and has carved out a specific niche: multi-exchange trading and monitoring. If you trade across several exchanges, Coinigy is arguably better than TradingView. It connects to over 45 exchanges through API, aggregating all your balances and positions into a single interface. You can monitor, analyze, and even execute trades across all connected exchanges without switching tabs.
The charting engine is solid, built on TradingView’s technology but with Coinigy’s data aggregation layer on top. You get access to real-time data from all major exchanges, which is crucial for spotting arbitrage opportunities or understanding true market depth. The platform also offers 24/7 portfolio monitoring with alerts for price movements, volume spikes, and balance changes.
One standout feature is the ability to set up automated trading strategies directly within the platform. You can create simple rules-based bots without writing code. This makes Coinigy a bridge between manual charting and full automated trading bots. For traders who want some automation without the complexity of dedicated bot platforms, this is a sweet spot.
The interface is functional but dated. It’s not ugly, but it doesn’t have the polish of TradingView or TradingLite. The learning curve is steeper than average, especially for configuring multiple exchange connections. That said, once you’ve set everything up, the workflow is efficient. Coinigy’s mobile app is also decent, covering the essentials without feeling cramped.
Pricing starts at $18.99/month for the Basic plan with 5 exchange connections and 3-month chart history. The Advanced plan at $49.99/month adds 20 exchanges and 2-year history. The Pro plan at $99.99/month includes 45+ exchanges and full history. There’s a 30-day free trial on all plans.
Key strengths:
- ✅ Unmatched multi-exchange connectivity with 45+ integrations
- ✅ Portfolio monitoring and alerts run 24/7 across all exchanges
- ✅ Built-in automated trading strategies without coding
- ✅ Real-time data aggregation for true market-wide analysis
- ✅ 30-day free trial on all plans
- ❌ Interface feels dated compared to modern charting tools
- ❌ Steeper learning curve for new users
- ❌ Charting features are good but not as deep as TradingView’s
Who it’s for: Active traders who operate across multiple exchanges and want consolidated monitoring, analysis, and execution in one place.
3. TradingLite , Best Budget-Friendly Option
TradingLite is the platform that’s been quietly eating TradingView’s lunch. It offers a clean, fast charting experience with a pricing model that undercuts the competition significantly. The free plan includes unlimited chart layouts, which is something TradingView charges $24.95/month for. That alone makes it worth a look for budget-conscious traders.
The interface is minimalist and fast. Charts load quickly, indicators apply smoothly, and the overall feel is responsive. TradingLite supports real-time data from major exchanges like Binance, Coinbase, and Kraken, with 10-minute delayed data on the free plan. That’s fine for swing trading but not ideal for scalping.
What TradingLite lacks in indicator depth, it makes up for in usability. The built-in indicators cover the essentials: moving averages, RSI, MACD, Bollinger Bands, and a handful of others. You won’t find 100+ indicators here, but for most traders, the core set is enough. If you need advanced indicators, you can use TradingLite for execution and a more feature-rich platform for deep analysis.
The platform also includes basic portfolio tracking and trade journaling features. This is a nice touch for Canadian traders who need to keep records for CRA tax purposes. You can export your trade history directly, which simplifies tax reporting. Pair it with a crypto tax software and you’re set.
Pricing is refreshingly simple. The free plan includes most features with delayed data. The Pro plan at $29.99/month adds real-time data, unlimited alerts, and advanced order types. There’s also a one-time lifetime license option that’s occasionally available, which is a bargain for long-term users.
Key strengths:
- ✅ Free plan includes unlimited chart layouts, a major win over TradingView
- ✅ Clean, fast interface that’s easy to learn
- ✅ Built-in trade journaling and portfolio tracking for tax records
- ✅ Simple pricing with a rare lifetime license option
- ✅ Real-time data on paid plans from major exchanges
- ❌ Limited indicator library compared to TradingView
- ❌ Delayed data on free plan makes it unsuitable for day trading
- ❌ Fewer exchange integrations than Coinigy
Who it’s for: Traders who want solid charting without the premium price tag, especially those who value simplicity and clean design over feature overload.
4. GoCharting , Best for Advanced Technical Analysis
GoCharting is the rising star in crypto charting. It’s built specifically for crypto traders, not shoehorned from traditional markets like some competitors. The platform offers over 50 technical indicators, plus advanced tools like Smart Money Concepts, Order Flow, and Volume Profile. These are the kinds of tools that professional traders pay hundreds of dollars for on other platforms.
The standout feature is the zero-commission model. GoCharting doesn’t charge for basic charting. You get real-time data, all indicators, and multi-chart layouts for free. The paid tiers starting at $19/month add premium features like deeper historical data, more alerts, and priority support. This is a disruptive pricing model that’s forcing competitors to reconsider their rates.
GoCharting also excels at on-chain data integration. You can overlay wallet activity, exchange flows, and other on-chain metrics directly on your charts. This is a huge advantage for traders who incorporate on-chain analysis into their strategies. It’s a feature you won’t find in TradingView or most other platforms without third-party plugins.
The platform supports direct trading from the chart across 20+ exchanges. Execution is fast, with an average order placement time of 1.2 seconds from chart to confirmation. For active traders, that speed matters. The interface is modern and customizable, though the learning curve is steeper than TradingLite due to the sheer number of features.
One area where GoCharting falls short is community. There’s no social feed like TradingView’s, so you won’t find shared strategies or public idea boards. For some traders this is a feature, not a bug. You get a cleaner, more focused experience without the noise.
Key strengths:
- ✅ Zero-commission basic tier with all indicators included
- ✅ Advanced tools like Smart Money Concepts and Order Flow built in
- ✅ On-chain data integration directly on charts
- ✅ Fast execution with support for 20+ exchanges
- ✅ Modern, customizable interface
- ❌ Steeper learning curve due to feature density
- ❌ No community or social features
- ❌ Newer platform with occasional bugs compared to established rivals
Who it’s for: Serious technical analysts who want advanced indicators and on-chain data without paying premium prices, and who don’t need social features.
5. CryptoCompare , Best for Data-Driven Analysis
CryptoCompare is more than a charting tool. It’s a comprehensive market data platform that includes charting, portfolio tracking, and news aggregation. If your trading strategy relies heavily on data analysis, this is worth a serious look. The platform aggregates data from over 200 exchanges, giving you one of the most complete pictures of the crypto market available.
The charting interface is functional but not flashy. It covers the essentials with candlestick charts, volume analysis, and a decent set of indicators. What sets CryptoCompare apart is the depth of data available. You can analyze historical data going back years, compare performance across exchanges, and access detailed order book data that most platforms don’t expose.
For Canadian traders, CryptoCompare’s portfolio tracking is particularly useful. It automatically syncs with your exchange accounts and tracks your holdings in CAD. The tax reporting features let you export transaction history in formats compatible with major tax software options. This integration makes tax season significantly less painful.
The platform also includes a news feed that aggregates headlines from major crypto publications. This is useful for staying informed, though the quality of the news aggregation varies. You’ll get some noise along with the signal.
Pricing is tiered. The free plan includes basic charting and portfolio tracking. The Premium plan at $29.99/month adds real-time data, advanced indicators, and API access. The Professional plan at $79.99/month is aimed at institutional users with full data exports and priority support.
Key strengths:
- ✅ Comprehensive market data from 200+ exchanges
- ✅ Integrated portfolio tracking with CAD support and tax exports
- ✅ News aggregation keeps you informed without switching apps
- ✅ Deep historical data for backtesting and research
- ✅ API access on paid plans for custom analysis
- ❌ Charting interface is less polished than dedicated tools
- ❌ Indicator selection is limited compared to TradingView or GoCharting
- ❌ Free plan has delayed data and basic features only
Who it’s for: Data-focused traders who want market-wide analytics, portfolio tracking, and news in one platform, and who prioritize information depth over charting polish.
Frequently Asked Questions
Is TradingView still the best crypto charting tool in 2026?
TradingView remains the most popular and feature-complete option, but it’s no longer the only game in town. Alternatives like GoCharting and TradingLite offer comparable features with different pricing models and strengths.
Can I use these charting tools for free?
Most platforms offer free tiers with basic features. TradingView’s free plan includes core charting, while Coinigy and TradingLite have limited free versions. Paid plans unlock advanced indicators, multi-chart layouts, and direct exchange integration.
Do I need to connect my exchange account to use these tools?
No. You can use most charting tools in read-only mode for analysis without connecting an exchange. Connecting an account enables live trading features, but that’s optional and carries security considerations.
How does the CRA view gains made using these trading tools?
The CRA treats cryptocurrency as a commodity. Every trade you execute, regardless of the platform you use to analyze or place it, is a taxable event. You must report capital gains or losses on your annual tax return. Check the CRA’s crypto guide for full details.
Which charting tool has the best technical indicators?
TradingView has the largest library with over 100 built-in indicators and thousands of community scripts. GoCharting is close behind with 50+ indicators and Pine Script support. Coinigy offers solid but fewer indicators, focusing more on multi-exchange data.
What Should You Remember?
- TradingView is still the benchmark for charting with the deepest indicator library and strongest community, but its pricing has crept up in recent years.
- Coinigy is the multi-exchange king with 24/7 monitoring across 45+ exchanges, making it ideal for arbitrage and diversified traders.
- TradingLite offers the best price-to-features ratio with a free plan that includes 10-minute delayed data and unlimited chart layouts.
- GoCharting is the rising star with zero-commission charting and advanced tools like Smart Money Concepts built in.
- Canadian tax obligations apply regardless of tool - the CRA requires you to track every trade as a taxable event. Consider pairing your charting tool with a crypto tax software to stay compliant.
- A clean interface matters more than feature count for most traders. You’ll actually use a tool that’s intuitive over one that’s overwhelming.
Disclaimer: This article is for informational purposes only and does not constitute financial or tax advice.