If you’re brand new, start with the beginner trading guide first — it covers order types, chart reading, and the risk management rules every strategy below depends on. The four strategies here build on those fundamentals, so the more comfortable you are with stop-losses and position sizing, the better each of these will treat you. —
Quick Answer
The four most practical crypto strategies in 2026 are dollar-cost averaging (DCA) (best for long-term accumulation with low effort), swing trading (best for capturing multi-day-to-week trends), grid trading (best for bots in ranging markets), and arbitrage (best for advanced users exploiting price gaps across exchanges). DCA suits most people; the others demand more time, skill, and risk tolerance. 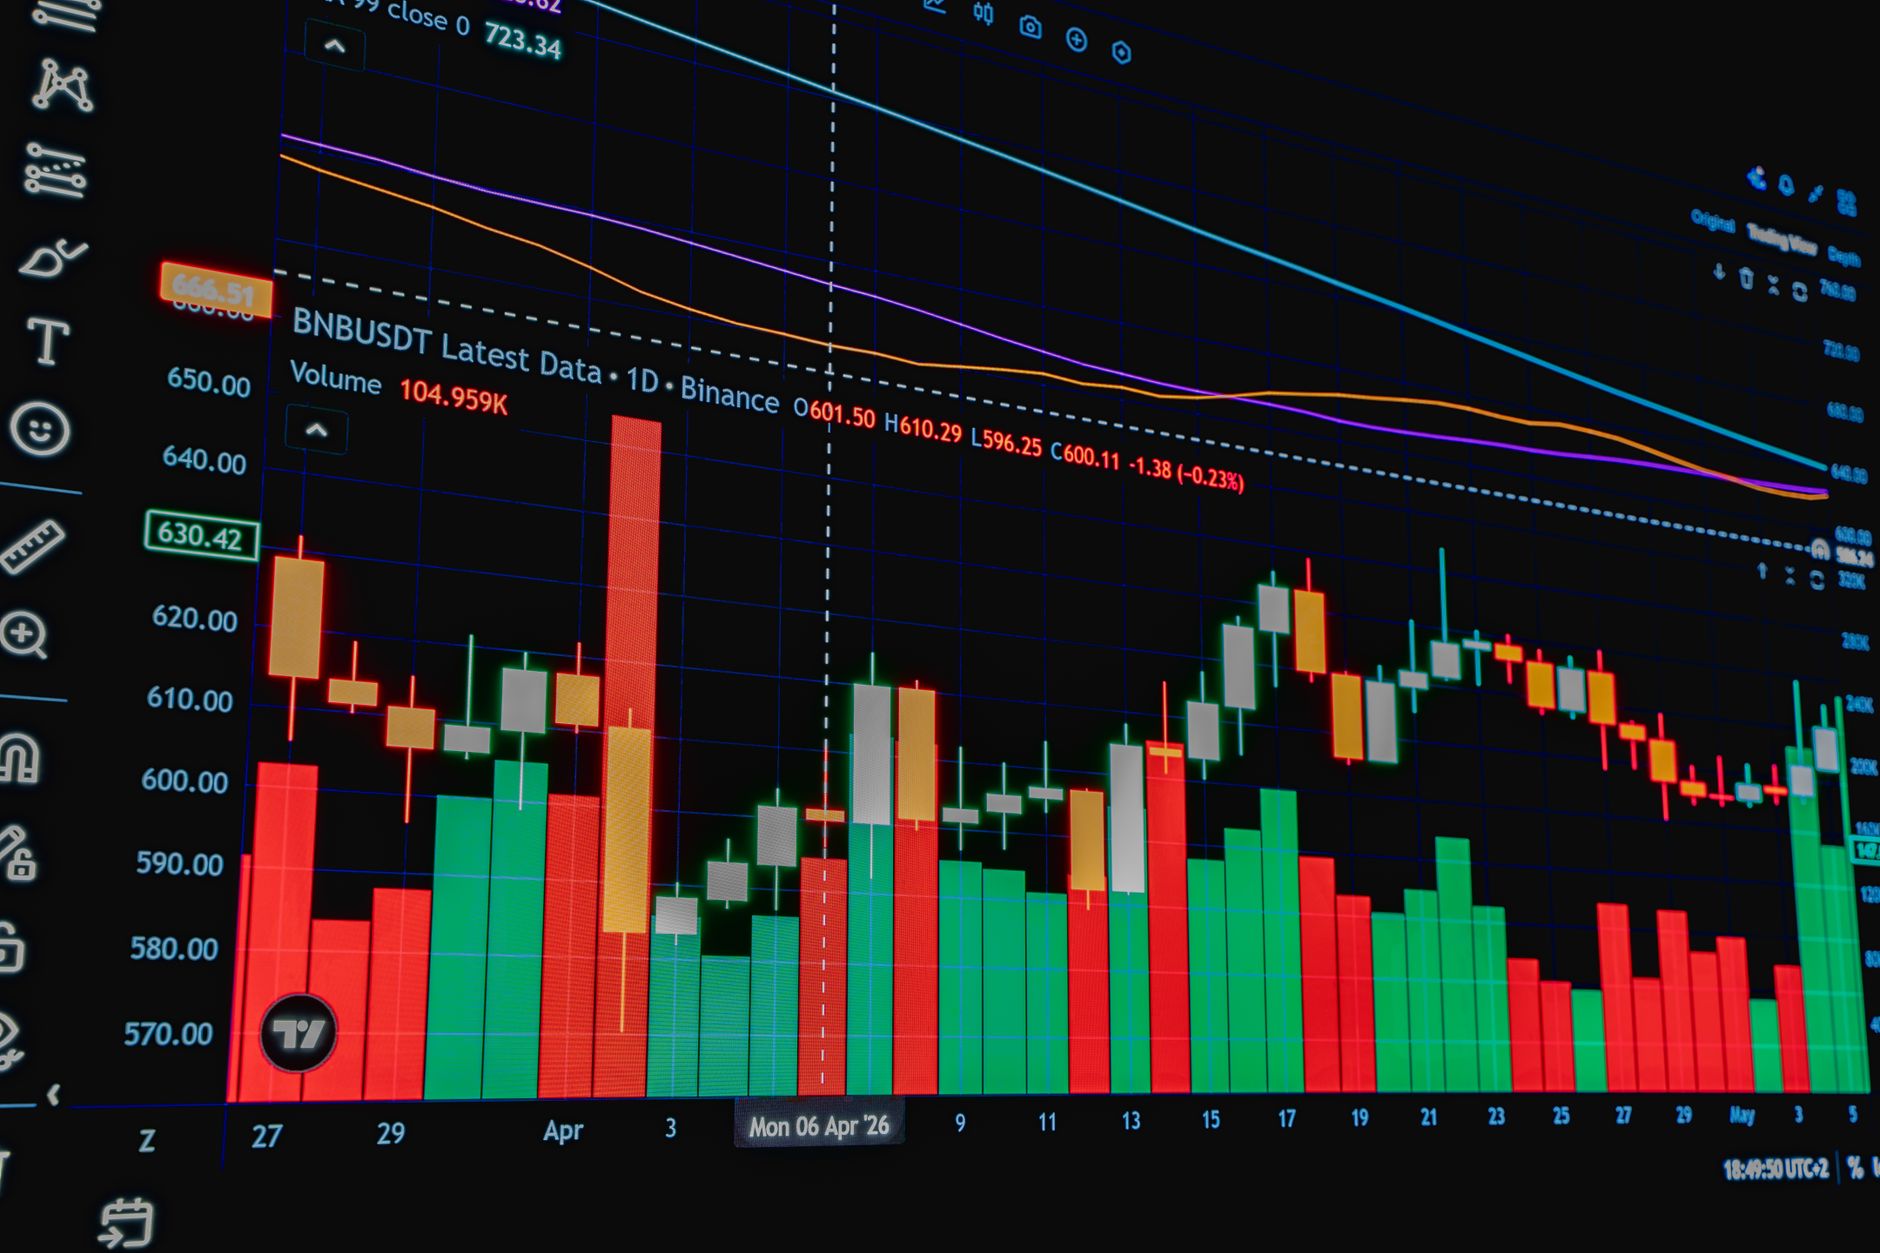
Strategy Comparison at a Glance
| Strategy | Effort | Timeframe | Skill Needed | Risk | Best For |
|---|---|---|---|---|---|
| Dollar-Cost Averaging (DCA) | Low | Months–years | Beginner | Low–moderate | Building positions over time |
| Swing Trading | Medium | Days–weeks | Intermediate | Moderate | Capturing trends |
| Grid Trading | Low (automated) | Weeks–months | Intermediate | Moderate | Ranging/sideways markets |
| Arbitrage | High | Seconds–minutes | Advanced | Low per-trade but complex | Fast, systematic traders |
1. Dollar-Cost Averaging (DCA) — Best for Accumulation
How it works: Invest a fixed amount into a chosen asset (e.g. $100/week into Bitcoin or Ethereum) at regular intervals, regardless of price. You buy more when the price is low and less when it’s high, averaging your cost over time. Why it works: It removes emotion and timing risk. You never need to “call the bottom”; you just accumulate steadily. Over long periods in an asset that trends up, DCA produces solid results with minimal stress. Pros:
- ✅ Low effort and emotionally simple
- ✅ Smooths out volatility
- ✅ Works for any asset, including stocks
Cons:
- ❌ Slower to compound for those chasing short-term gains
- ❌ You hold through downturns (need conviction)
To see why DCA is the emotionally and statistically easier path, it helps to run a thought experiment. Suppose you started in early 2020 with two options, both ending in early 2025:
- Lump sum: Put $120,000 into Bitcoin all at once on January 1, 2020 (about $25,000 per coin). - DCA: Split that same $120,000 into $500 per week over roughly five years. If you lump-summed at $25,000 and Bitcoin later peaked above $100,000 before settling near $80,000–$95,000 at the end of the window, your stake would have roughly 3–4x-5x’d. That looks great in a pure bull market — and it’s exactly why lump sum wins when the market only goes up. But here’s the catch: you don’t know the start price in advance. The realistic version of this test includes buying at the top. Consider someone who lump-summed $120,000 in November 2021 when BTC hit roughly $68,000. By late 2022, Bitcoin had fallen below $16,000 — their position was down over 75%. Recovering from a 75% drawdown requires a 300% gain, not just to break even at their entry but to make any real money. Many people, watching a six-figure stake wither, capitulated and sold at the bottom. The same investor using $500/week DCA through that whole ugly bear market was steadily buying cheaper and cheaper coins. Their average cost kept falling, they never had to face a catastrophic drawdown on their total capital, and they remained emotionally calm enough to stay in. When the 2023–2024 recovery arrived, their average entry sat far below the peak, so they were in profit much earlier. That’s the core trade-off:
| Approach | Best case | Worst case | Emotional load |
|---|---|---|---|
| Lump sum | Maximum upside if you nail the timing | Painful drawdown if you buy at the top | High — can cause panic selling |
| DCA | Slightly less upside in a straight bull run | Far smaller drawdowns, lower average cost | Low — easy to stay the course |

How it works: Buy an asset expecting it to rise (or sell expecting a fall) over days to weeks, riding “swings” between short-term highs and lows. You use trend analysis, support/resistance, and a few indicators to time entries and exits. Why it works: It captures more of a move than very short-term day trading while requiring far less screen time. You can combine swing entries with DCA for a core+opportunistic approach. Pros:
- ✅ Higher return potential than DCA in trending markets
- ✅ Less stressful than day trading
- ✅ Trade frequency is manageable
Who it’s for: Traders with some experience who can commit a few hours a week and use stop-losses. ### Swing Trading with Chart Indicators: A Walkthrough
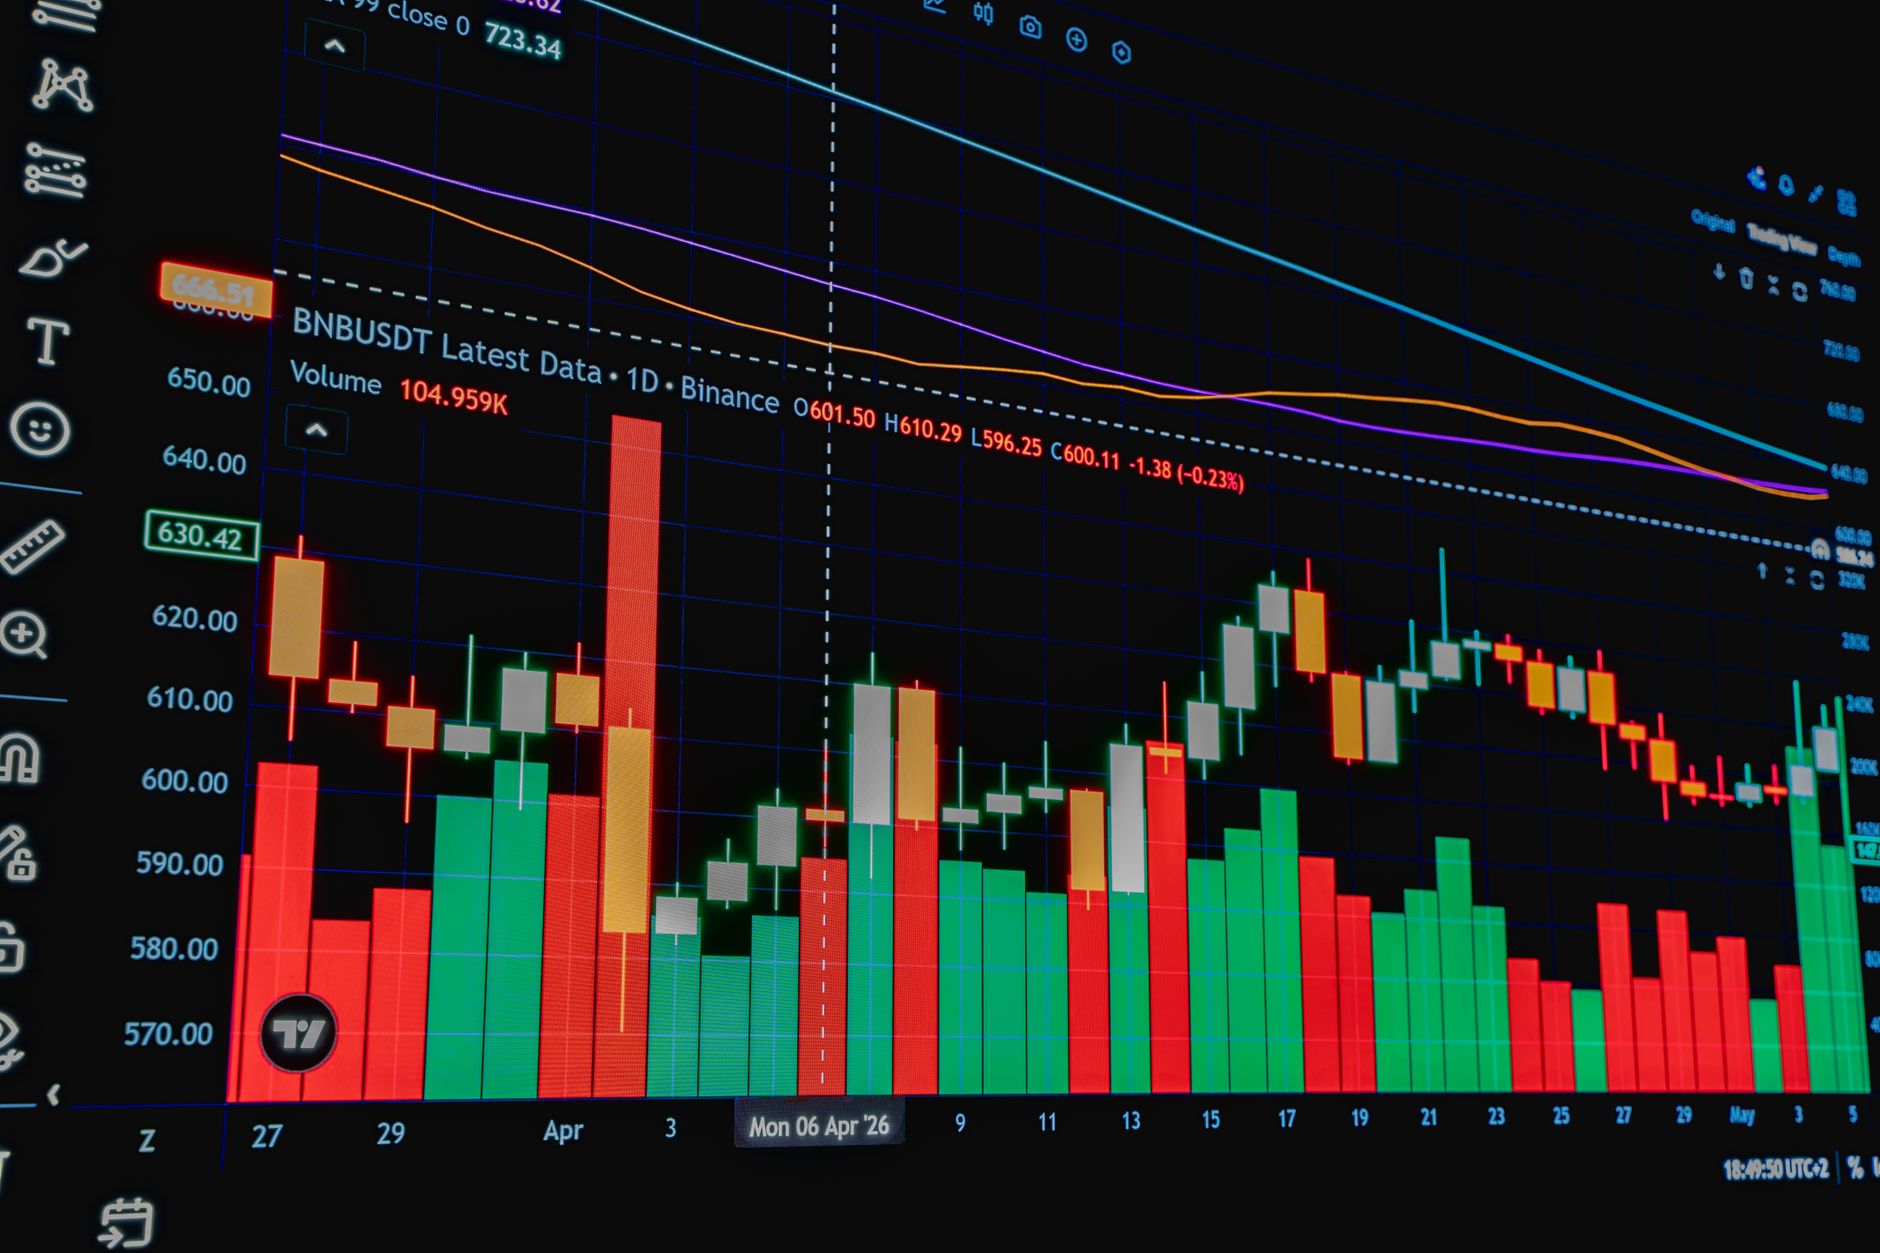
Swing trading lives and dies on chart analysis. Here’s how three widely used tools come together in a realistic setup — this is the kind of signal combination you’d look for on a daily (1D) or 4-hour (4H) chart. Relative Strength Index (RSI). RSI reads momentum on a 0–100 scale. In a swing context, a reading below 30 flags an oversold condition, and a reading above 70 flags overbought. On its own, RSI is weak — a strong uptrend can stay “overbought” for weeks, and a strong downtrend can stay “oversold” just as long. Swing traders use RSI as a filter, not a trigger: prefer long entries when RSI has dipped toward 30–40 and started turning back up, and avoid adding longs when RSI is pegged at 75+. Moving Average Convergence Divergence (MACD). MACD tracks the relationship between a fast and slow moving average to show trend direction and momentum. The key signals:
- Bullish crossover: the MACD line crosses above the signal line — a momentum-up signal. - Bearish crossover: the MACD line crosses below the signal line — a momentum-down signal. - Zero line: above zero leans bullish, below zero leans bearish. Swing traders often wait for a bullish MACD crossover near or below the zero line as a higher-confidence entry than one deep into a rally. Support and Resistance + Trendlines. The least technical, most reliable tool is simply drawing lines. Mark the price levels where the asset has repeatedly bounced (support) or stalled (resistance). A swing entry idea forms when price pulls back to support and an indicator like RSI or MACD confirms a turnaround; the exit idea forms at the next resistance level. Putting it together — a realistic example. Imagine BTC is in an uptrend on the daily chart. Price pulls back to a well-established support zone around $60,000. At the same time:
- RSI drops toward 35 and begins curling upward (oversold but turning). - MACD prints a bullish crossover below the zero line. A swing trader might:
Cons:
- ❌ Loses money in strong trends — if price breaks out, your grid can be stuck on the wrong side
- ❌ Needs careful range selection
- ❌ Fees can eat small grid profits
Grid bots are built into a handful of exchanges and third-party platforms. The two most common entry points are Pionex (which offers free built-in grid bot templates) and 3Commas (a popular bot marketplace that connects to exchanges like Binance and Bybit). Both work on the same principle: you set a price range, a grid spacing, and a grid count, then the bot populates buy and sell orders across that range and takes profit on each cycle. How the math works. Suppose you run a grid on a $1.00–$2.00 range with 20 grid lines, so each grid step is $0.05 (roughly 3.3% spacing at the lower end). The bot buys at each declining grid line and sells at the next line up. Every time price moves up one full grid step, the bot earns that ~3.3% gap (minus fees). In a volatile but range-bound market, the price might cross a grid line dozens of times, stacking up small profits. Let’s run a concrete profit calculation. Say the bot starts with $1,000 evenly deployed across the grid, and the coin oscillates such that price crosses an average of 5 grid steps upward per day (price bounces up and down several times). If each average grid step is 2% after fees:

Arbitrage isn’t one technique — it’s a family of approaches, each with a different mechanism and difficulty level. Understanding them helps you see why most traders skip the whole idea. 1. Spatial (cross-exchange) arbitrage. Buy an asset on one exchange where it’s trading slightly lower, and sell it on another where it’s a hair higher. The challenge is that the gap is usually fractions of a percent and closes within seconds as other bots rush in. You must have funds pre-positioned on both exchanges (transfers take time and pay network fees), and each leg pays trading fees plus conversion costs. Example: if BTC is $60,100 on Exchange A and $60,160 on Exchange B, gross profit is $60 per coin — but after paying buy fees, sell fees, and a network transfer fee, and waiting for a withdrawal that may take minutes while the gap closes, the realized profit is frequently negative. 2. Triangular arbitrage — the currency loop. This happens entirely within one exchange and doesn’t require moving funds between venues. You cycle through three pairs: buy BTC with USDT, buy ETH with BTC, then sell ETH back for USDT. If the cross-rates don’t perfectly align — e.g., BTC/USDT implies a slightly different ETH price than ETH/BTC suggests — you can close the loop with a tiny profit. Example: with $10,000 in USDT, a 0.1% discrepancy yields just $10 gross — before paying three sets of trading fees that likely total more than $10. Triangular arbitrage is essentially impossible to run profitably by hand; it requires algorithmic speed and split-second execution. 3. Statistical arbitrage (stat-arb). This is broader and longer-horizon. Instead of targeting a guaranteed price gap, you use historical data to find correlated assets that have diverged from their normal relationship. For example, if two major layer-1 tokens historically move together and one suddenly lags (or spikes) far out of line, a stat-arb trader shorts the overpriced one and buys the underpriced one, betting they’ll converge. This requires modeling, backtesting, and constant rebalancing — genuinely the domain of quantitative teams, not casual traders. The bottom line on arbitrage. Every form has the same three killers: fees, speed, and capital. If you’re not running automated software with money waiting on multiple venues and a robust fee schedule, arbitrage is more likely to lose you money to costs than to earn you a profit. Most retail traders should treat the concept as educational, not operational. Pros:
- ✅ Low per-trade risk if executed correctly
- ✅ Market-neutral (less directional risk)
Who it’s for: Only advanced, systematic traders with automation skills. Beginners should skip it. —
You don’t have to pick one:
 and [ETH](/articles/how-to-buy-ethereum). Swing → liquid majors with clear trends. Grid → stable, range-bound pairs. Arbitrage → assets deep on multiple venues. Avoid illiquid [meme coins](/articles/meme-coins-guide) for strategies needing reliable fills. > ⚠️ **Disclaimer:** Informational only, not financial advice. All active trading strategies carry real risk of loss, especially leveraged or automated ones. Only trade money you can afford to lose. *Disclaimer: This article is for informational purposes only and does not constitute financial advice.
## The Bottom Line
<p>This guide covers what you need to know. Check our related articles for deeper dives into specific topics.</p>
</div>
<section class=](/images/crypto-trading-strategies-body-4.jpg)